
Support and Resistance
In stock market, Forex and
Crypto Trading technical analysis, support and resistance are certain predetermined levels of the
market price at which price is thought that the price will tend to stop and
reverse.

A support or resistance level is formed
when a market’s price action reverses and changes direction,
Typically support and resistance levels
containing price within a trading range. A trading range is simply an area of
price contained between support and resistance levels.
Support always forms below the current market price of a security.
How to Plot Support Level or Zone?
To Plot Support Level or Zone follow the below steps-
- Look back historical price data.
- Identify extreme lows.
- Mark all the low touch points.
- Connect all the touch points.

Resistance always forms above the current market price of a security.
How to Plot Resistance Level or Zone?
To Plot Resistance Level or Zone follow the below steps-
- Look back historical price data.
- Identify extreme highs.
- Mark all the high touch points.
- Connect all the touch points.

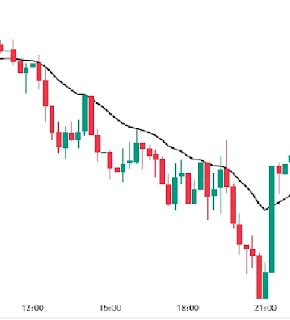
Dynamic Support and Resistance:
Common Dynamic Support & Resistance Tools:
Moving Averages (MA)
Acts as dynamic support in an uptrend and resistance in a downtrend.
Popular MAs: 50-day, 100-day, 200-day EMA/SMA.

Trendlines
Drawn by connecting higher lows (uptrend) or lower highs (downtrend).
Price often bounces off these trendlines.

Fibonacci Retracement Levels
Dynamic levels (e.g., 38.2%, 50%, 61.8%) that act as support/resistance in trends.
Ichimoku Cloud (Kumo)
The cloud acts as dynamic support/resistance.
Pivot Points (Dynamic Calculation)
Unlike fixed pivot points, some traders adjust them based on volatility.


Why Use Dynamic Support & Resistance?
✔ Better for trending markets (unlike static levels, which work best in ranges).
✔ Adapts to market changes (useful in volatile conditions).
✔ Helps identify trend strength (if price holds above/below dynamic levels, trend is strong).
Dynamic support and resistance help traders identify key levels in trending markets. Combining them with price action confirmation (like candlestick patterns) improves accuracy.